
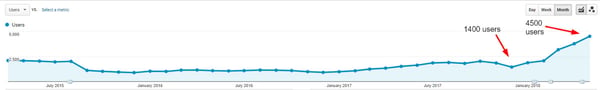
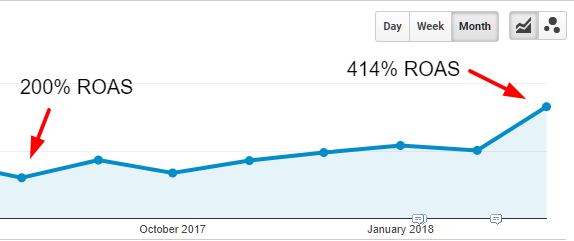
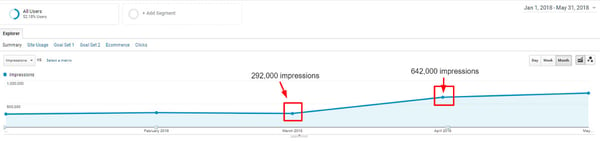
Actual month-over-month revenue growth over the past 3 years
Actual month-over-month revenue growth over the past 3 years
When we first met this Rhode Island-based manufacturer over 3 years ago, they had no online presence–including a website.
Their business existed largely through wholesale relationships earned over time through their premium product and exceptional service.
Although they were complete strangers to E-commerce, the organization saw a clear opportunity to supplement their traditional wholesale business by entering the online marketplace.
Our digital marketing team at Trailblaze Marketing knew early on that building a solid foundation with a smart website structure would be critical to their long-term E-commerce success.
Picking the wrong platform for your online store can cost your business a lot of money in the long run.
You may be wondering:
Why is it such a big deal? It's just the website right?
Nope, the platform and host you choose will ultimately affect the level of control you have over your online business, including the website’s structure, responsiveness, speed, security, customer service, and much more.
WooCommerce holds more than 22% of the global market share for E-commerce platforms.
After careful deliberation and a full inventory of our client's existing and future needs, we chose BigCommerce, a popular software that offers a hosted E-commerce platform for building an online store.
This decision was primarily made based on two types of considerations:
1.) Business requirements
2.) User and customer requirements
As a BigCommerce partner, we felt confident with its integrations, plugins, CMS, level-of-customization, and ease-of-use for our client.
Below are some important questions you can use to assess your needs when selecting an E-commerce platform:
After getting the platform squared away, we began implementing what would become the the website's core conversion strategy:
And by the way, it's far easier to implement this type of structure earlier than later.
If you do however adjust the hierarchy or URL structure of your website, make sure you spend time mapping the old URLs to the new ones.
This will make your life a whole lot easier when it comes time to redirect the old to the new.
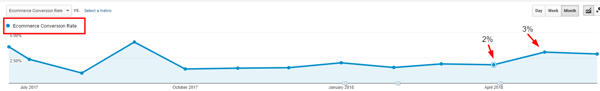
Having taken these steps early on, our client sleeps just fine at night knowing their store conversion rate is 4%.
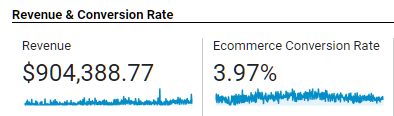
The average E-commerce conversion rate is between 1% and 2%, but varies considerably depending on the the industry.
Whatever you do, simplify the path-to-purchase.
During the initial site design we made the mistake of putting too many products on the homepage; in other words, we gave people too many options.
This problem was easily diagnosed using the behavior flow report in Google Analytics.
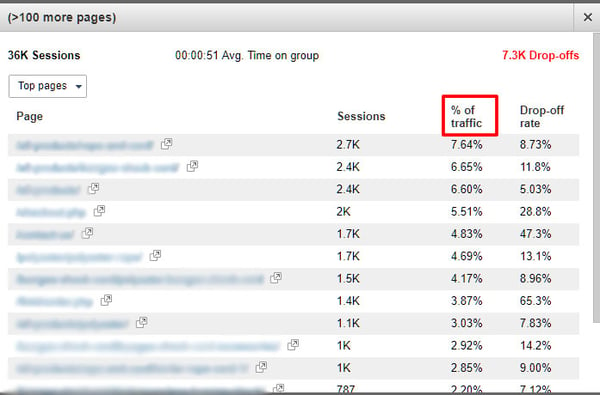
It was here we found that the bulk of their homepage visits went to just a few of the product category pages.
This insight has since prompted a homepage redesign which should only improve conversion rates further.
It gets better too:
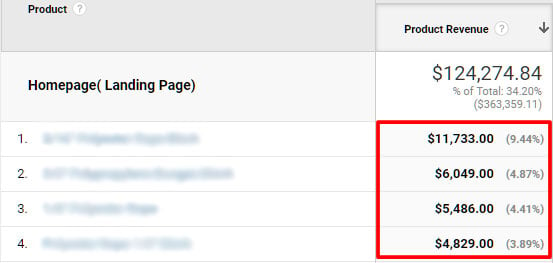
Recently, we wanted to know exactly what these people were buying, so we created a custom segment in Google Analytics that included only homepage landing page sessions.
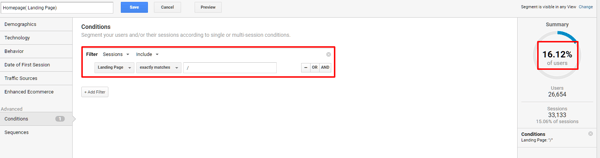
What we found was that 22% of the revenue generated from homepage landing page sessions was attributed to just 2% of the 167 products available (4 products).
Pretty great insight, right?
If you're not using segments in Google Analytics you're missing out on an abundance of valuable data.
When it comes to E-commerce, category pages are where the traffic is earned, and product pages are where the money is made.
Optimizing these is critical.
Think about when you shop online, what are the on-page elements that draw your eye the most?
Probably high-quality images, a thoughtful product description with frequently asked questions, a shipping and return policy, and of course reviews.
More than 70% of all customers consult reviews or ratings before making a final purchase.
After the client's website proved to receive little organic traffic, we focused on creating unique and highly detailed content for each product and category page.
Although it proved challenging to do this for every product, we spent time interviewing our client and performing comprehensive keyword research to make sure each page was unique.
In fact, weak, duplicated content across online stores is an extremely common issue for E-commerce businesses which significantly restricts their growth.
To complement this transactional content, we recommended that our client begin blogging to target search queries with informational intent.
The goal of this was two-fold:
1.) Create site-wide topical relevancy, facilitating a search engine's understanding of the website
2.) Earn backlinks and then funnel that authority to the product pages through internal linking .
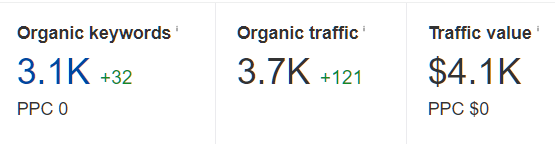
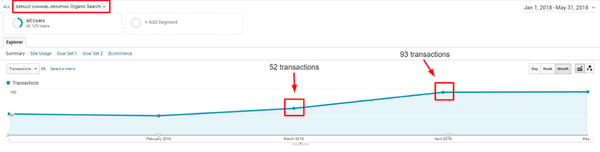
The organic profile of our client's website in 2018
Other actions we took to make sure these pages would convert:
Want to see how Google defines a high quality E-commerce product page? Here's an example.
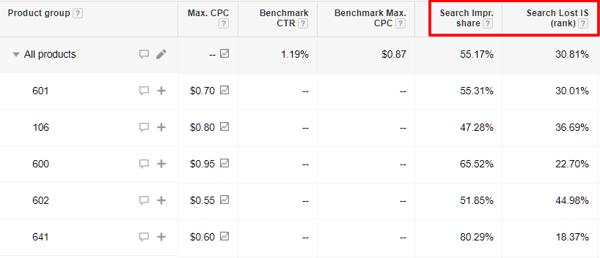
With a solid foundation in place, we turned our focus to Google Shopping.
Each campaign was turning a profit, but we lacked impression share due to a restricted budget. Understandably, our client was apprehensive to invest further until we could prove a strong, consistent return-on-ad-spend.
Our marketing for this client was entirely service based, too, meaning we weren’t on retainer. On top of this, we began seeing increased competitive pressure from major retailers like Amazon, which was driving up costs.
All of this lead to one solution:
Focusing on the quality and structure of each paid campaign–allowing us to strategically decrease our acquisition costs.
Product listing ads accounted for 85% of paid clicks in Q1 of 2018.
Now, here's a little secret that most agencies keep to themselves...
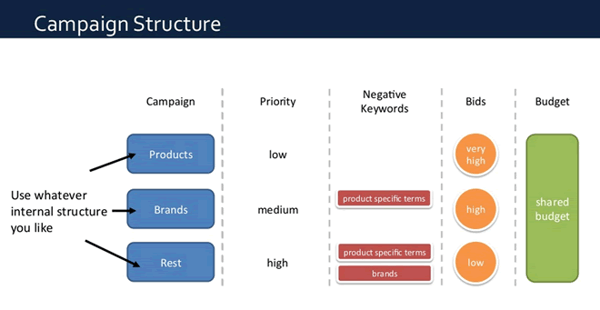
The success of a Google Shopping campaign is largely based on the account structure. (Disagree? Tweet us @trailblaze_mktg and share why)
Yes, return-on-ad spend, product margin, cost-per-click, conversion rate, etc. all matter in the world of Google Shopping, but how you deal with commercial intent matters more.
Structuring your campaign around each level of intent allows you to spend more of your budget on the search queries that actually convert, while still driving demand at the top of the funnel.
Think about this:
Does it make sense to pay the same per click for these two searches below?
Search 2: Nike men’s AirMax 90 shoes size 10
Of course not.
That first search query indicates that they have no idea what they want, and that’s exactly why we don't want to pay much for the click.
Each purchase has to start somewhere though, and if your funnel is properly set up then you shouldn't worry about picking up those same searchers when they’re further along in the decision making process.
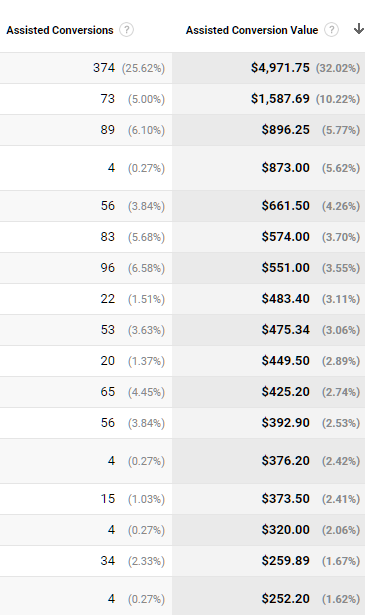
Assisted conversions is an overlooked metric that will help you gauge the role each channel, campaign, or ad group plays throughout the decision making process.
In fact, paid search has generated nearly $200,000 in assisted revenue alone.

This means that while customers saw our ads through Google, they ended up converting through another channel like organic, direct, referral, etc.
Pretty crazy, right?
It makes sense considering just 2% of first-time visitors to an online store will complete a transaction.
What are you doing to retain the other 98%?
When we first got started on the search network we made sure to spread budget around.
This was to test the waters to understand what products would sell, how often they would sell, and at what cost.
We also collected a bunch of data to apply to the SEO campaigns we would eventually run.
Here's what happened:
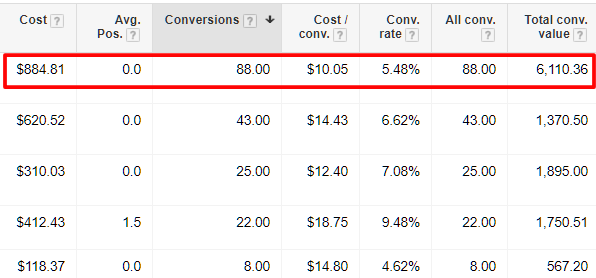
We quickly discovered that the majority of ROAS (return on advertising spend) from the search network was coming from a single ad group, our client’s flagship product.
Our next move was simple:
We cut every product from the search network except for their top seller (their flagship product) and continued running the other products on the shopping network.
The results were immediate:
This same lesson applies to negative keywords. Once you trim the fat by sculpting the search queries that trigger your ads, more budget becomes available for the products that generate a strong ROAS.
At this point, we were starting to collect some meaningful data, allowing for more aggressive bid adjustments.
We discovered that the majority of transactions were occurring during the week between 9am and 5pm on desktop computers.
At first we were puzzled.
We couldn’t understand why, in a world dominated by mobile, 84% of revenue was coming from desktops.
And then it hit us… B2B!
Although we had always known that businesses were a core audience for our client, we underestimated the exact role they played.
63% of revenue comes from just 13% of their customer base, who happen to be returning visitors.
-1.png?width=600&name=Screenshot%20(1)-1.png)
That’s right, 13% of their customers are responsible for over 63% of the revenue!
Insane.
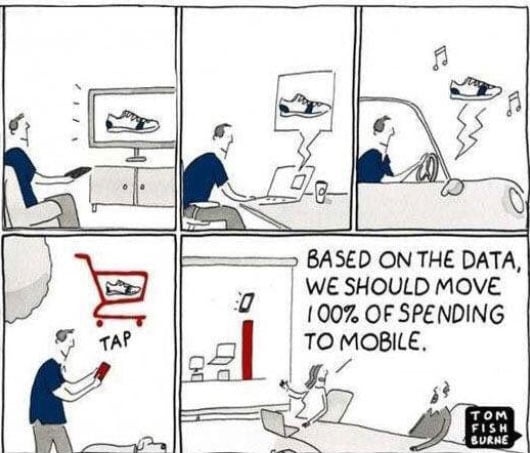
Moral of the story? Although Google's mobile-first index is a real thing and worth optimizing for, you need understand YOUR target audience's behavior.
We don't have to tell you that Amazon is an absolute powerhouse in the world of E-commerce.
They were responsible for 44% of all U.S. E-commerce sales in 2017.
Let’s be real:
It’s impossible to compete with them on a brand level, you have to take the fight to the product level.
See, Amazon ranks for millions of keywords because of the OVERALL strength and authority of its domain. The authority of each product page is relatively weak since that authority is spread thin among millions of pages.
Amazon's $356 billion valuation is so big, it's larger than Wal-Mart, Target, Best Buy, Macy's, Kohl's, JCPenney, and Sears combined.
Click to tweet: Amazon’s weakness is exactly what makes it so great to begin with. It offers everything for sale, and you can exploit this.
Click to tweet: And by the way, it’s much cheaper to retain a customer than it is to acquire a new one.
Since we started with content marketing at the beginning of 2017, our team has written everything there is to know about our client’s product.
221% organic grow over 6 months
On top of this incredible organic growth, we’ve acquired plenty of backlinks in the process, and have established our client as an authority in their respective industry.
These same blog posts have assisted in plenty of transactions too:
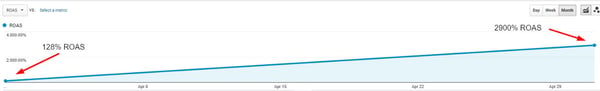
What allows us to provide such consistent results for our clients is our RAO methodology, an in-house approach built around strategically reviewing, analyzing, and optimizing various data points.
This process is one of the reasons why our client was able to scale their ROAS almost effortlessly, helping transition our relationship from service based to a monthly retainer.
This gave our agency more resources to work with, including access to other marketing channels like organic, social, and email.
Something that is OFTEN overlooked in E-commerce is attribution, or how credit is distributed across the touch points that contribute to a sale.
Attribution is especially important in E-commerce because the model you use ultimately determines how your results are presented.
For an agency, this is critical, and an important factor when looking to grow.
A few common attribution models used by marketers include:
In our client's case, we knew attribution would greatly affect the accuracy of all future optimizations, giving us a reason to move further away from the Google Analytics default 'last click' model.
In fact, to illustrate the difference between first and last attribution, check this out:

With last click, our reports would say $147k generated from paid search.
With first click, our reports would say $294k generated from paid search.
Pretty big difference, right?
With this insight we've been able to accurately report on our client's Google Shopping investment, while also showing the influence this channel has had on other marketing initiatives (and vice versa).
Remember, in order to accurately assess and optimize against the performance of your online store, you need to look at every touch-point to understand the role each channel played in the ultimate conversion.
One easy way to do this?
The Top Conversion Paths report found in Google Analytics:
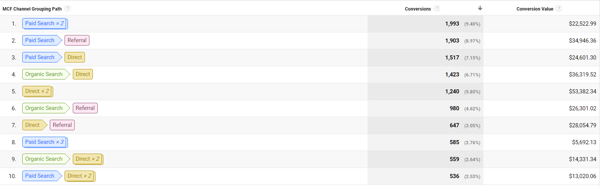
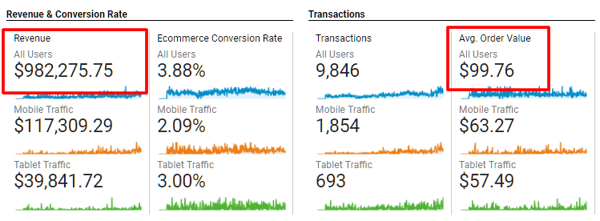
Looking at this report we quickly see that while paid search drives the most transactions, the revenue per transaction is noticeably smaller than channels involving organic search.
Remember earlier when we discussed assisted conversions?
Through this report in Google Analytics you can take your analysis a step further by setting your primary dimension to ad group, as opposed to channel, allowing for a much more holistic view of how each group is working together.
True story: we have a client (in a different industry) who averages around 15 assisted conversions for every one direct conversion.
Starting to see why this is so important?
Based on the data we had accrued, we felt confident making structural changes to campaigns, as well as bid adjustments at the product level.
Businesses make an average of $2 in revenue for every $1 they spend on AdWords.
We focused mainly on cutting low-performing products, allowing our budget to funnel towards the real money makers.
We also started scaling impression share at the product level using negative keywords and bid adjustments:
Naturally, with any E-commerce store there will be products that:
We found products that fit in every single one of these categories. How we optimized them depended largely on the category, but the strategy was to do any of the following:
We started gradually implementing these changes around October and the results started becoming obvious by the early spring:
The best part about a retainer model is that we can do whatever is necessary for our clients in order to generate results. We’re not limited to specific services based on a contract (i.e. 4 social posts a week, 2 emails a month, etc.).
One thing we consistently noticed was that although certain products generated a boatload of revenue on the Google Shopping network, they also had insanely high acquisition costs.
The solution?
Search engine optimization for these same products. With SEO, we knew we could see the same sales at a cost of basically $0.
43% of E-commerce traffic comes from organic search while 26% comes from Google AdWords.
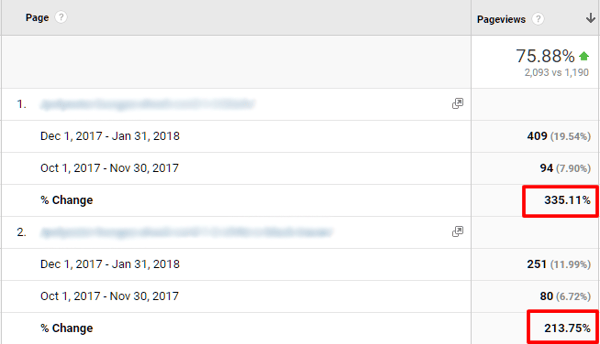
One of these optimizations involved adding high purchase intent search queries to product titles, giving more weight to the terms we knew converted at a higher rate, like color and size.
We also found that because a lot of these customers were businesses, they used industry jargon that B2C consumers didn’t–which we also included in product titles.
Lastly, we went over to Sonar, an Amazon keyword scraper, and dug out a bunch of hidden gems to include in our product descriptions; doing so increased content freshness, semantic relevance, and the quality of our product feed.
These changes resulted in an impressive 335% increase in page views for one of the product pages:
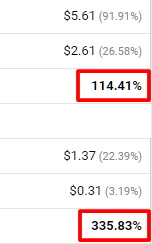
But not only that, these same pages saw a massive surge in the page value (revenue divided by page views):
When data validated our idea that businesses would be a highly profitable audience, our team started developing targeted messaging and marketing campaigns.
Although the verticals these buyer’s belonged to were quite diverse (making it challenging to pinpoint just one or two), we knew most returning customers were likely businesses.
[Note: A Website and SEO audit is great at uncovering these types of insights]
With an average conversion rate of nearly 10%, deciding to increase repeat visitors was a no-brainer. We also became hyper-focused on bulk buyers–a smaller but highly profitable audience.
In 2015, Google found that close to half of B2B buyers are millennials, nearly double the number from 2012.
Our first tactic was implementing display ads targeting bulk buyers. For those of you who have ever run a display campaign, you know how tough it can be to show return-on-ad-spend.
Unfortunately, display advertising often requires a more holistic and intricate view of attribution and performance, as opposed to the overly simplistic last-click model most businesses use.
Unfortunately, display advertising often requires a more holistic and intricate view of attribution and performance, as opposed to the overly simplistic last-click model commonly used with search.
When assessing the performance of display, it’s important to look at higher-level, macro trends across your entire store.
In this case, our campaign has resulted in multiple transactions with very high order values, but what it’s also done has supported demand in other channels:
120% increase in impressions from Google Display campaign launched in March
79% increase in transactions generated from organic over this same time period
To complement the display campaign, we added site visitors (retargeting) as an audience on top of each shopping campaign. We then added aggressive bids on each of these audiences, resulting in massive return-on-ad-spend.
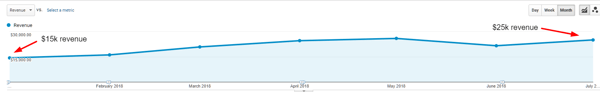
Naturally, monthly revenue from returning visitors has shown an average increase of nearly 70% since the beginning of 2018:
Reviews are an incredibly important component of a successful E-commerce store.
According to Shopify, 70% of customers consult reviews or ratings before making a final purchase, and 63% of consumers are more likely to purchase from a site if it has product ratings and reviews.
From day one, we knew just how much power each review carried, so we took steps to put our client’s first-rate product quality and reputation on display for everyone to see.
Leveraging the relationships our client was building every day, we began an email campaign with the goal of generating reviews for their Google My Business page, the most viewed asset their business has when it comes to reputation.
The results?
24 brand new five-star reviews in a matter of days.
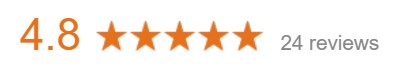
But what's even better:
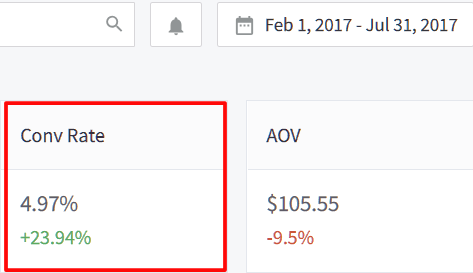
Our conversion rate skyrocketed by 24% in the 6 months after this campaign was implemented, compared to the 6 months prior.
We’re not saying this impressive gain in conversion rate was attributed entirely to our review generation campaign, although we believe it played a HUGE role, but what we found was for every new review we generated there was a 1.2% increase in transactions.
Now that we had established our client as a reputable supplier in their industry through reviews, it was time to focus on specific products.
We implemented schema markup (aggregate rating) on every product page.
For those who are unaware, schema markup is a type of code that helps a search engine understand what is on your page, or in this case, allows Google to show product reviews in the search results, like this:
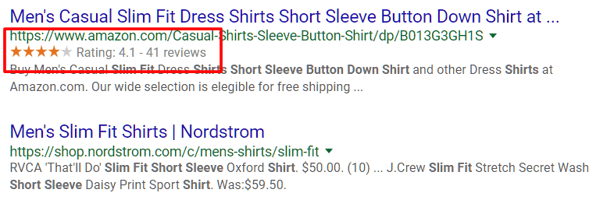
After implementation, we saw a 50% increase in organic product landing page conversion rates:
A similar feature is available through Google’s search and shopping network called "seller rating extensions".

Once you have enough reviews from third-party, independent sources, Google will selectively begin showing this extension on your product listing and search ads, like this:
This advertiser saw a 29% increase in click-through-rate to their product listing ads by using seller rating extensions.
We’re currently in the process of collecting the required amount of reviews (advertisers now need at least 150+ from independent sources to begin showing) and will update this when we can measure its impact on performance.
![]()